Implement Monitoring / Tracing
When operating a microservice application, you quickly come to the point, where you want to have some insights of the services running in your cluster. With Istio / Kubernetes, there are several options to achive this.
- Azure Application Insights / Azure Monitor
- we do not cover that topic in this workshop. If you want to learn more about these options, have a look at the predecessor of this workshop (Chapter 4): https://github.com/CSA-OCP-GER/phoenix/blob/master/challenges.4.md
- Prometheus
- open-source systems monitoring and alerting toolkit
- Grafana
- open source metric analytics & visualization suite
- Kiali
- new kid on the block :) built with Istio service-mesh in mind
In our example, we are going to use the “built-in” options Prometheus/Grafan and Kiali.
Here is what you will learn
- Install Prometheus/Grafana components in your cluster
- Learn how to use the Grafana Dashboard
- Install Kiali service in your cluster
- Learn how to use the Kialia Graph
- Gain insights about “the moving parts” your service mesh
Grafana / Prometheus
Because we installed Istio with the profile “DEMO”, Grafana is already installed and ready to use. Just move on to Access Grafana
Access Grafana
Because the Grafana Dashboard is not exposed to the public internet, we need to access Grafana via port-forwarding:
First, get the Grafana service:
$ kubectl get svc -n istio-system

NAME                     TYPE           CLUSTER-IP     EXTERNAL-IP     PORT(S)                                                                                                                                      AGE
grafana                  ClusterIP      10.0.171.17    <none>          3000/TCP                                                                                                                                     23m
istio-citadel            ClusterIP      10.0.170.169   <none>          8060/TCP,15014/TCP                                                                                                                           23m
istio-egressgateway      ClusterIP      10.0.219.107   <none>          80/TCP,443/TCP,15443/TCP                                                                                                                     23m
istio-galley             ClusterIP      10.0.218.14    <none>          443/TCP,15014/TCP,9901/TCP                                                                                                                   23m
istio-ingressgateway     LoadBalancer   10.0.95.107    52.157.96.148   15020:30313/TCP,80:31380/TCP,443:31390/TCP,31400:31400/TCP,15029:32424/TCP,15030:32535/TCP,15031:32676/TCP,15032:32171/TCP,15443:32596/TCP   23m
istio-pilot              ClusterIP      10.0.118.30    <none>          15010/TCP,15011/TCP,8080/TCP,15014/TCP                                                                                                       23m
istio-policy             ClusterIP      10.0.253.232   <none>          9091/TCP,15004/TCP,15014/TCP                                                                                                                 23m
istio-sidecar-injector   ClusterIP      10.0.221.133   <none>          443/TCP,15014/TCP                                                                                                                            23m
istio-telemetry          ClusterIP      10.0.197.52    <none>          9091/TCP,15004/TCP,15014/TCP,42422/TCP                                                                                                       23m
jaeger-agent             ClusterIP      None           <none>          5775/UDP,6831/UDP,6832/UDP                                                                                                                   23m
jaeger-collector         ClusterIP      10.0.27.86     <none>          14267/TCP,14268/TCP                                                                                                                          23m
jaeger-query             ClusterIP      10.0.234.107   <none>          16686/TCP                                                                                                                                    23m
kiali                    ClusterIP      10.0.120.41    <none>          20001/TCP                                                                                                                                    23m
prometheus               ClusterIP      10.0.188.227   <none>          9090/TCP                                                                                                                                     23m
tracing                  ClusterIP      10.0.149.89    <none>          80/TCP                                                                                                                                       23m
zipkin                   ClusterIP      10.0.8.183     <none>          9411/TCP                                                                                                                                     23m
$ kubectl port-forward svc/grafana 3000:3000 -n istio-system
Forwarding from 127.0.0.1:3000 -> 3000
Forwarding from [::1]:3000 -> 3000
Open your browser on http://localhost:3000.
Todos for you
First, run the Calculator application in loop-mode and put some load on your cluster.
Now…
- get familiar with the Grafana Dashboard and the preconfigured charts (under
Homedropdown > Istio dashboards) - see how your services are consuming CPU / memory / disk resources
- measure incoming requests
- “deep-dive” into measures of one service
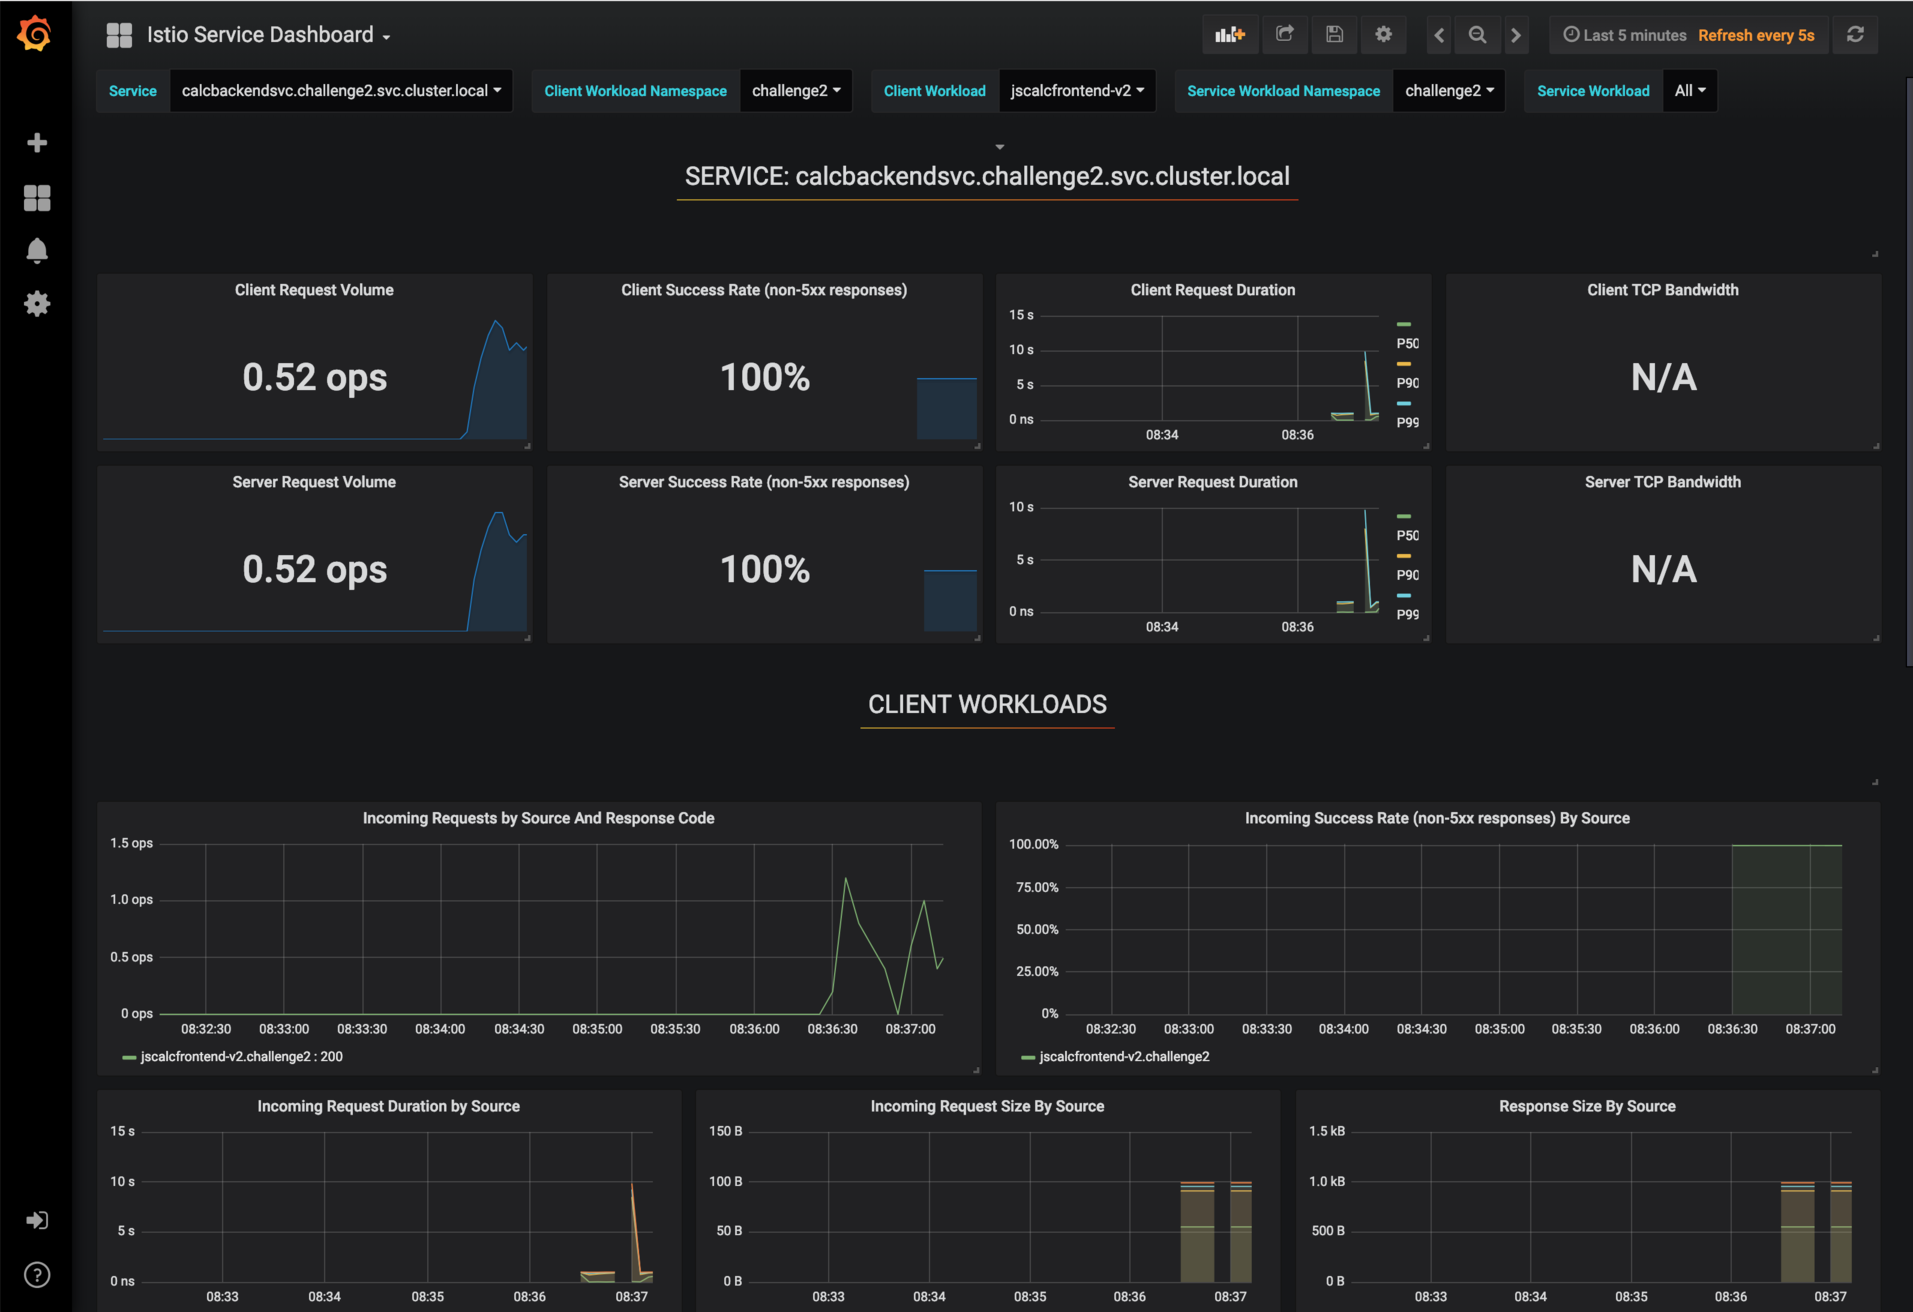 Sample Dashboard
Enable Kiali
Because we installed Istio with the profile “DEMO”, Kiali is already installed and ready to use. Just move on to Access Kiali
As mentioned above, Kiali is a new solution that is designed especially for Istio. It can answer the following questions:
- what services are part of my Istio service mesh?
- how are they connected?
- how do they perform?
- are there any errors in communication?
Access Kiali
To be able to open the Kiali, execute the following command:
$ kubectl port-forward svc/kiali 20001:20001 -n istio-system
Forwarding from 127.0.0.1:20001 -> 20001
Forwarding from [::1]:20001 -> 20001
Now, open your browser at http://localhost:20001/kiali/console/overview and login with the standard credentials (admin/admin).
Todos for you
First, run the application in loop-mode and put some load on your cluster.
Now…
- get familiar with Kiali (open Application, Workload and Services views) and see, what metrics and information Kiali can provide for your service mesh
- open the service map under Graph and display Service Nodes and Traffic Animation
- get detailed information about services by clicking on a node in the graph
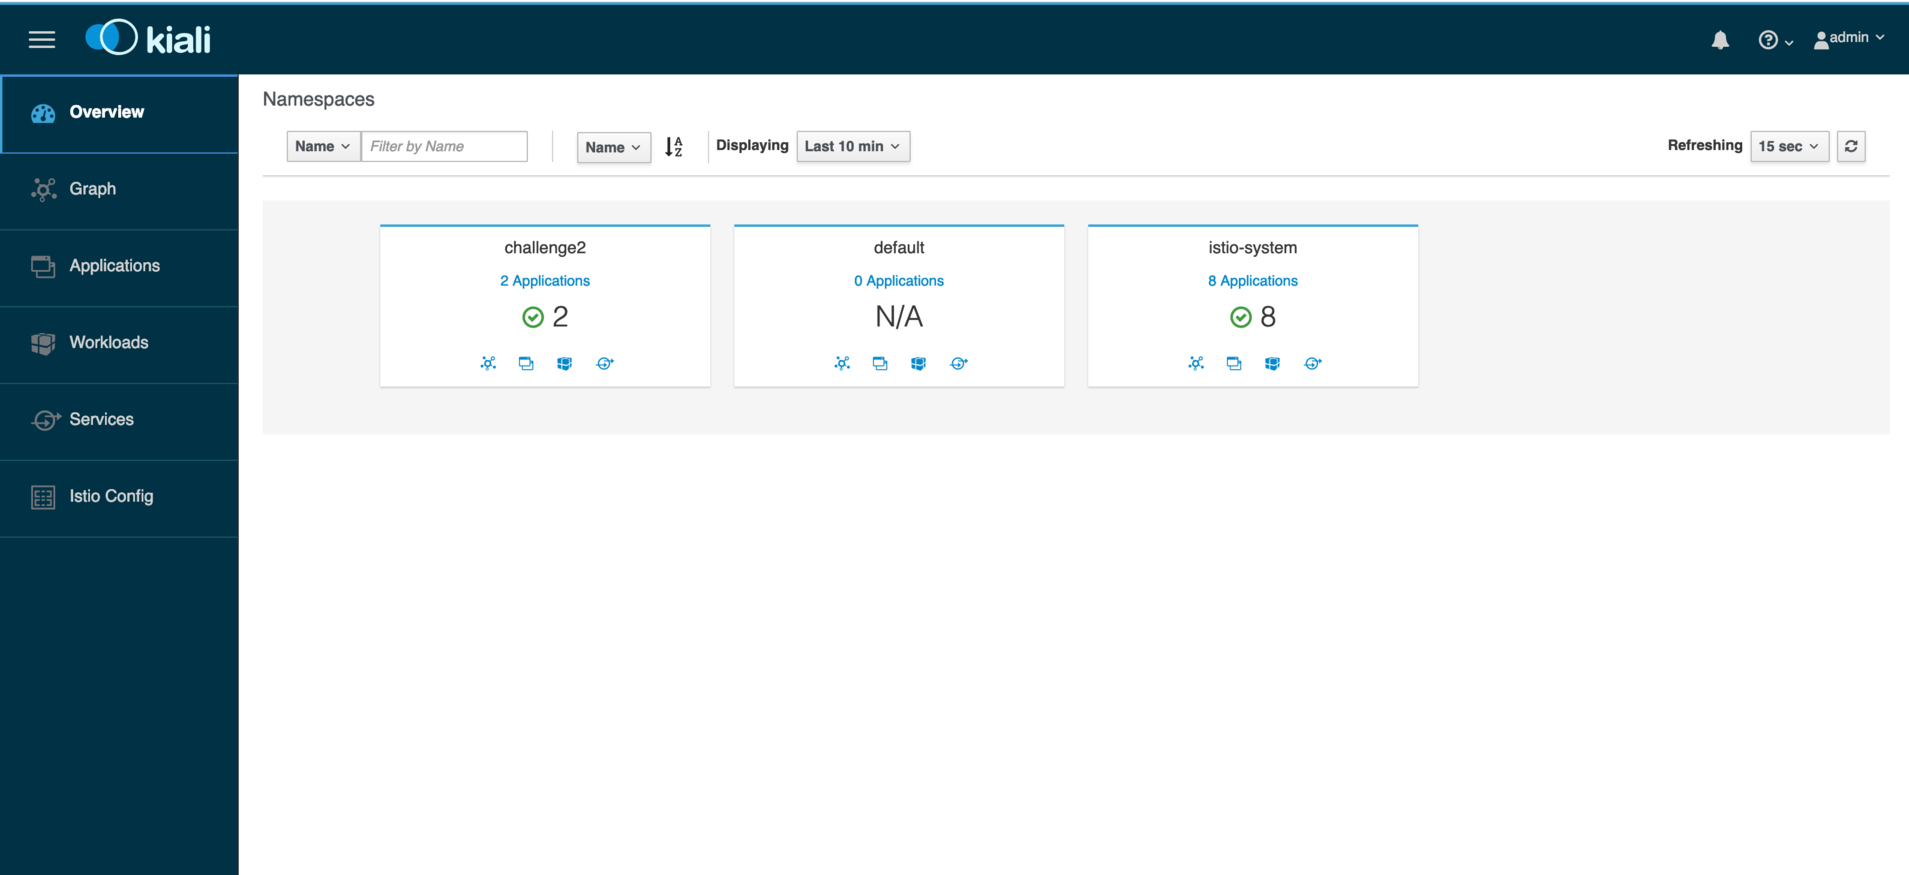
Overview
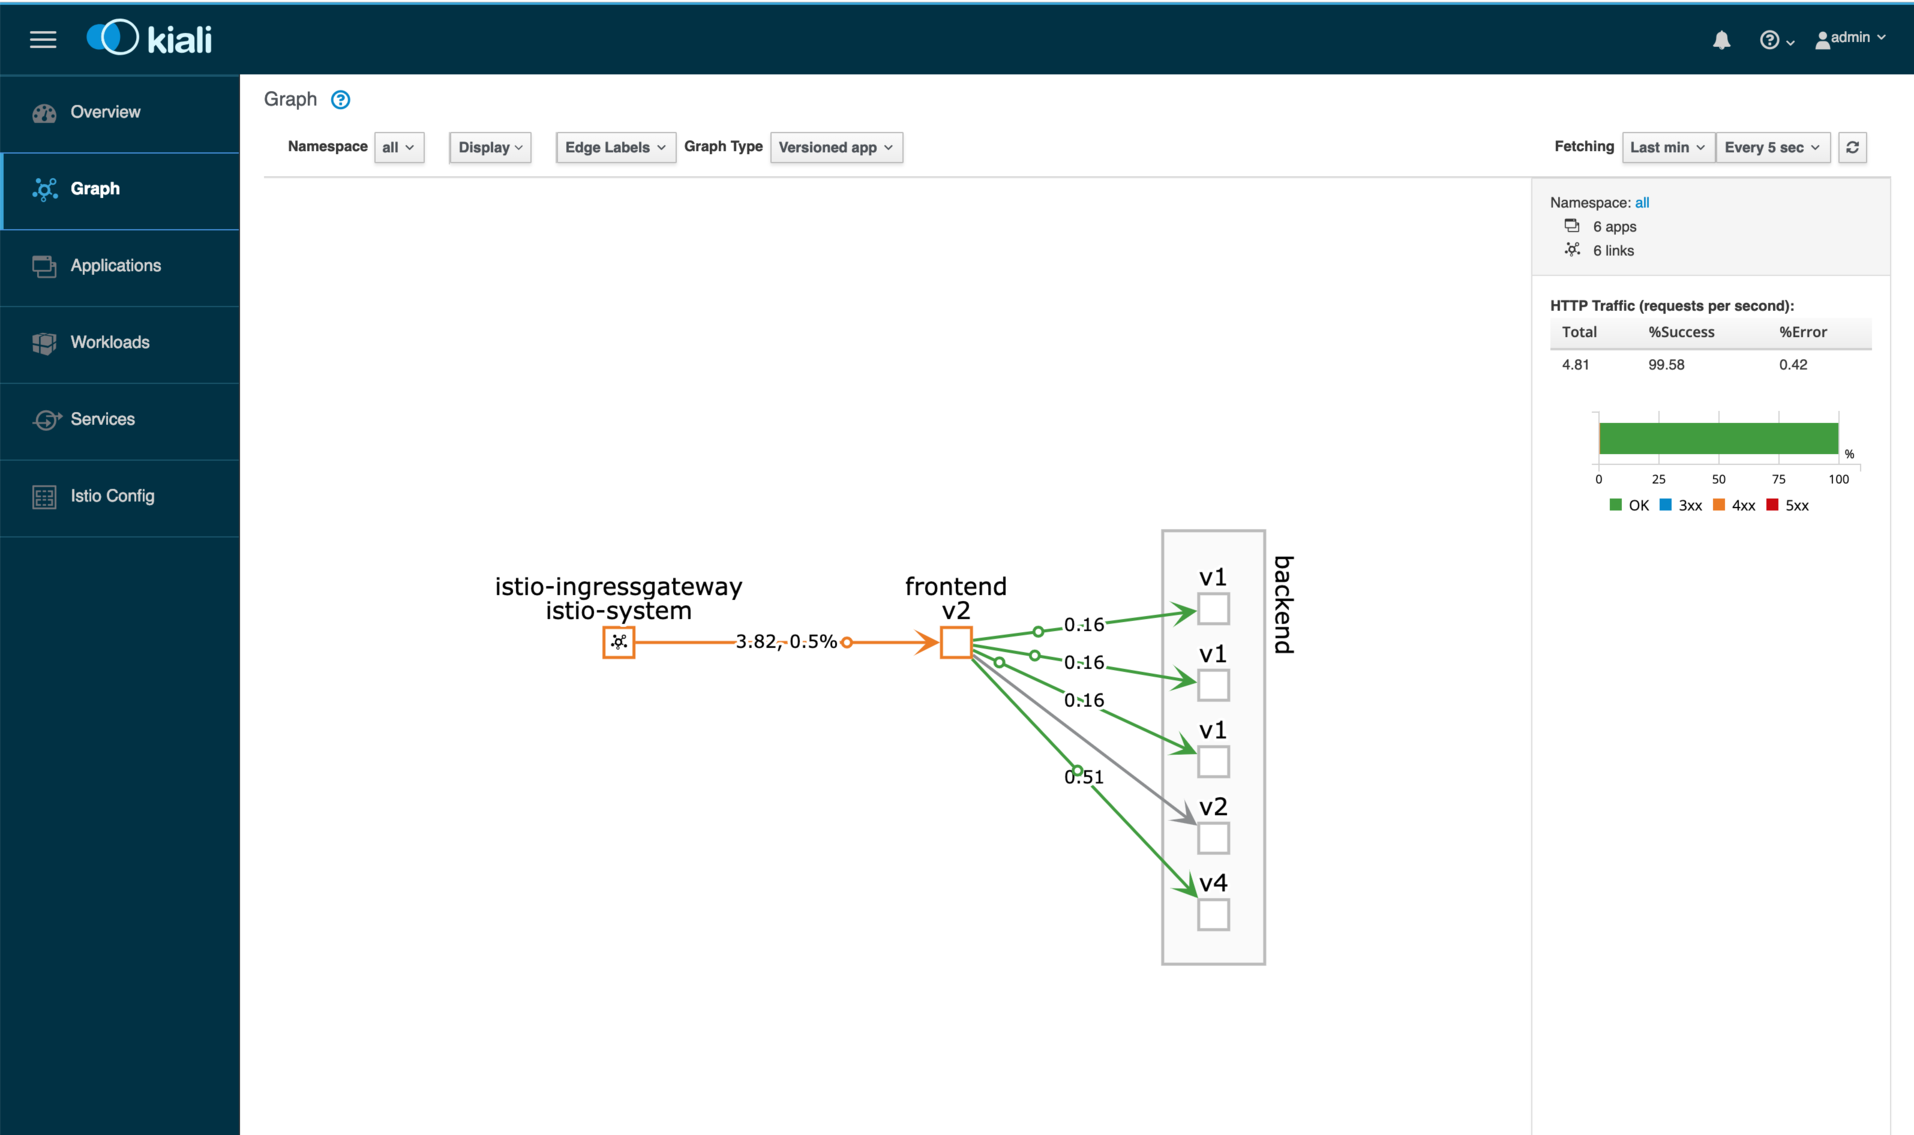
Kiali Service Map
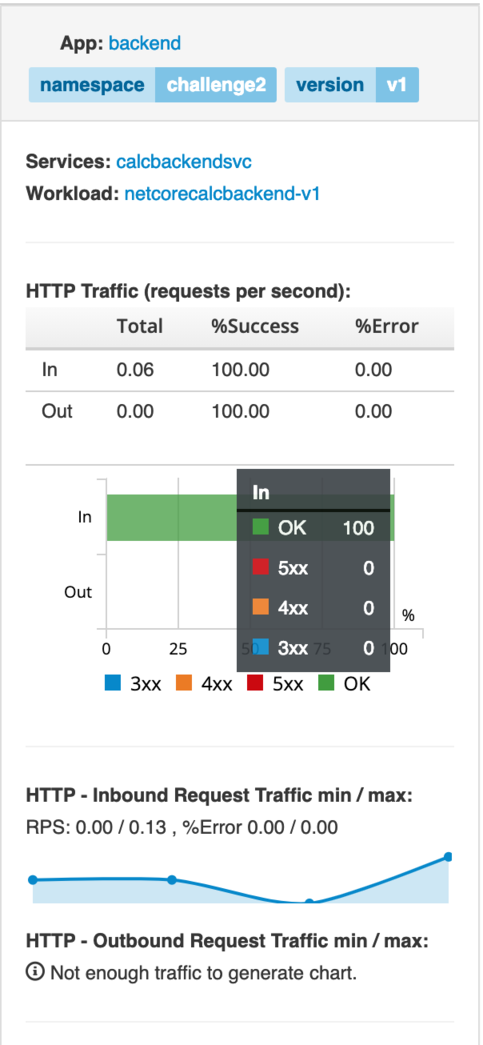
Kiali Service Info